On my Oura data (some lessons)
[Feb 2025]
Intro: I have had an Oura ring for just over a year now, and I thought I would post some lessons learned, and show some data. Until now I haven’t looked at the medium/long term trends, only looking at today's values in the app1. I am most interested in looking at sleep quality as a driver of cognitive function and resting heart rate as a measure of fitness/health.
Relevant Terms and Data Points2:
- Sleep score (0-100): An Oura calculated score capturing total sleep quality, using various parameters3.
- Readiness score (0-100): An Oura calculated value for readiness, analogous to sleep score, with different contributing parameters4.
- Resting heart rate (bpm): Average resting heart rate whilst sleeping. For me this is ~43bpm and for the population it is 50-60bpm. Within a given individual's genetic range lower is always better5.
- Heart rate variability (HRV) balance: Average waking hour heart rate variability (HRV), where HRV measures the difference in timing of your heart beats. The science of HRV is complex but the general claim is that a high HRV indicates a well-rested state. Moment to moment the true demands on the heart fluctuate, and ideally the heart fluctuates in tandem. Somewhat counterintuitively, a tightly fixed heart rate is a sign of fatigue.
- Deep sleep time (min): Associated with physical repair/growth. Deep sleep is good.
- REM sleep time (min): Associated with memory, learning and creativity. REM sleep is good.
- Total sleep time (min): Self-explanatory.
More on resting heart rate: There are genetic differences as some people have larger stroke volumes (~larger hearts) giving lower resting heart rates and lower max heart rates, and vice versa. For reference my max heart rate is ~182bpm, which is on the low side for my age/fitness level. Some elite athletes have max heart rates of 210bpm and resting heart rates of ~30bpm, which indicates insane aerobic capacity. The aim is to keep your resting HR low as you age - or ideally bring it down - and improve your power output or speed at higher heart rates, as an indicator of VO2max.
More on sleep score: Subjectively, sleep score correlates with next day cognitive function and work capacity. However, to me a 95 sleep score feels no better than an 85. There is no clear correlation with next day HRV balance6 or next night resting HR. I’m not sure that the Oura team could say that a 95 vs 85 sleep score leads to better X where X is a future measured variable.
Lessons:
- Your consistent caffeine intake negatively affects sleep, but it is single-day increases in caffeine that have a more pronounced effect.
- Coffee (which is not just bitter caffeine water) is much worse than tea or “pure” caffeine.
- You really can physically outwork a massive caffeine intake.
- Low carb dinners improve sleep, as does an earlier last mealtime.
- The best way to get a great sleep score on a given day is to have had a poor sleep the night before. Lower caffeine, lower stress, meal timing and composition help, in descending order of impact.
- Oura can catch illness before you do.
The last point is the most interesting and needs data – not just an explanation – to know. See plots below where I have flagged ill periods and periods of consistent alcohol consumption (holidays).
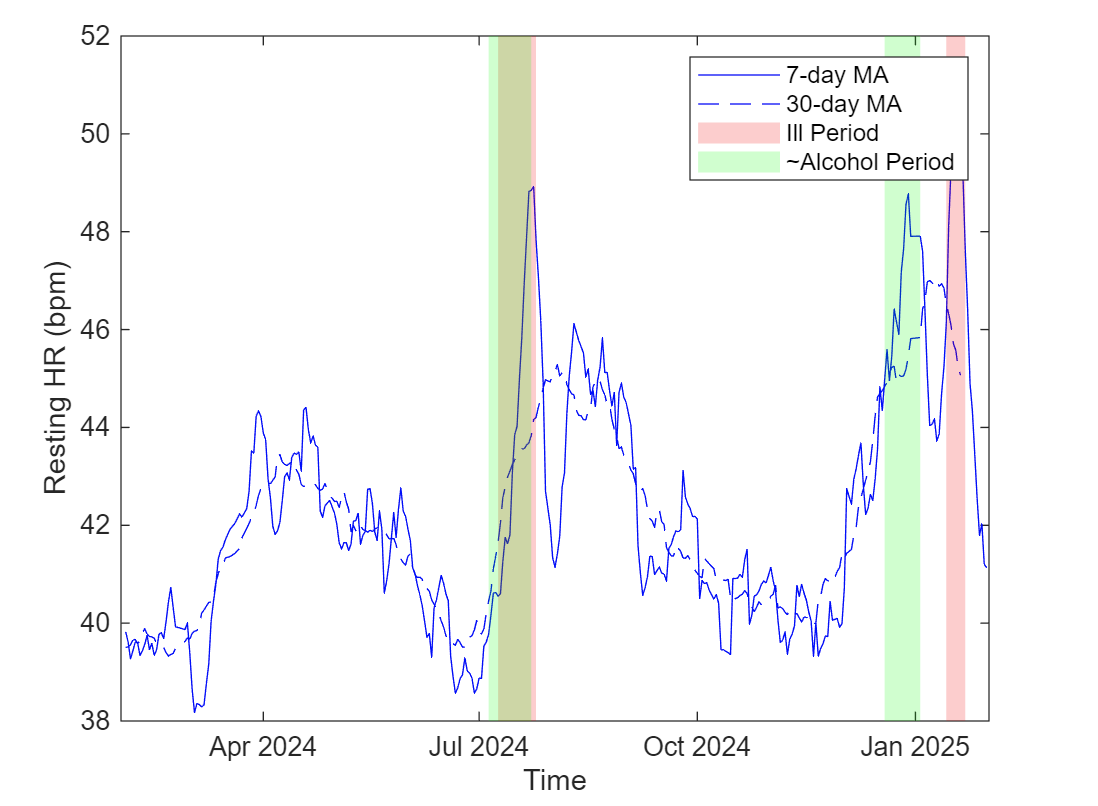
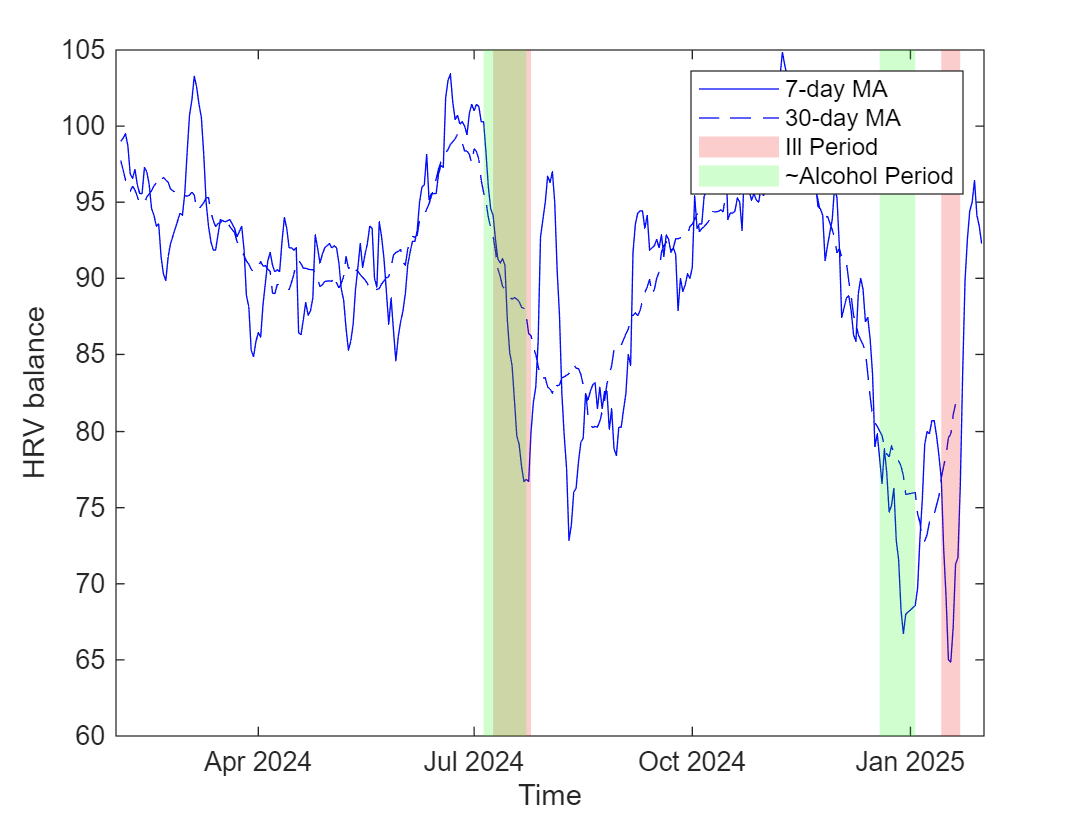
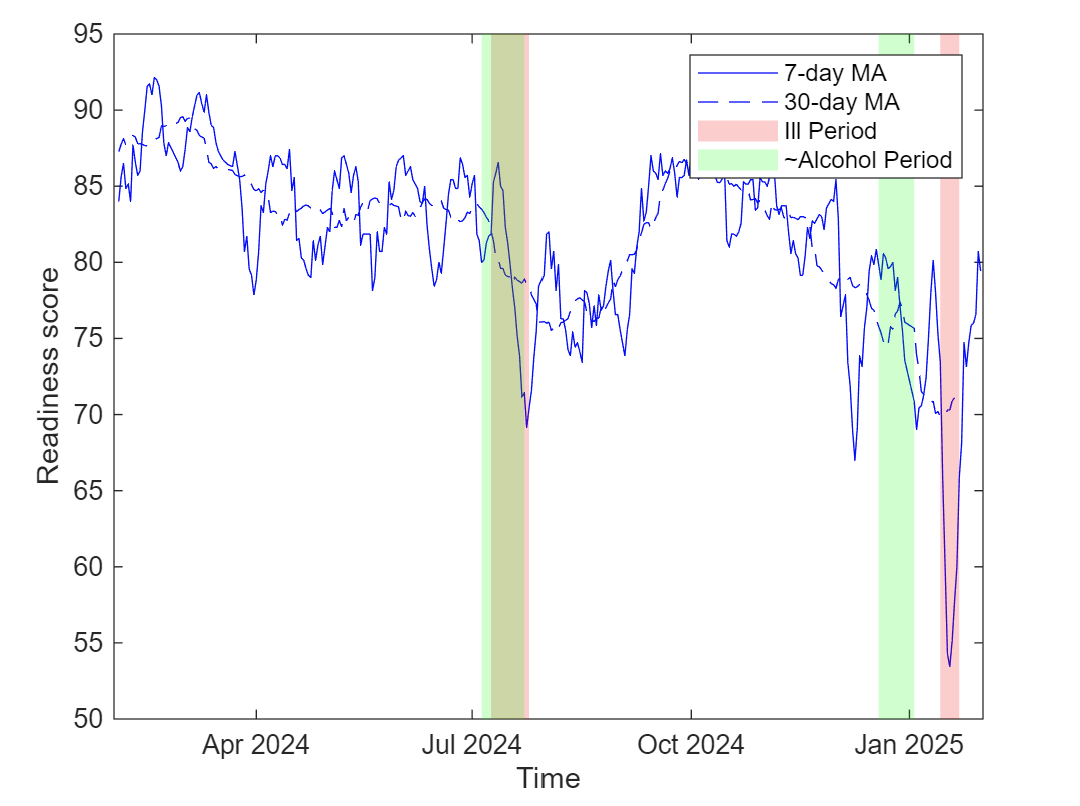
By the eyeball test we can see that periods of higher alcohol intake negatively affect resting HR, HRV balance and readiness, as does illness. I can also say that for both periods my Oura was giving me poor readiness scores prior to me feeling ill, although I failed to act on it. I can also say that after the July 2024 ill period I got back to training too quickly and remember failing easy workouts on the bike, which you can see in the post-illness massive drop in HRV balance. Or that at least is my explanation. Also note that whilst the coloured bands seem to negatively affect the measures, the charts are not fully explained by them. There are short and long-term trends not due to illness or alcohol. They are also not due to exercise.
Regarding exercise data, I did look at the activity balance metric but unfortunately the Oura app doesn’t seem to pull in all Strava data consistently, and I can’t be bothered getting it from the Strava API as I’m guessing that the short-term effects of cardio are drowned out by the illness and alcohol effects. Also, periods of exercise heroics will decrease HRV balance.
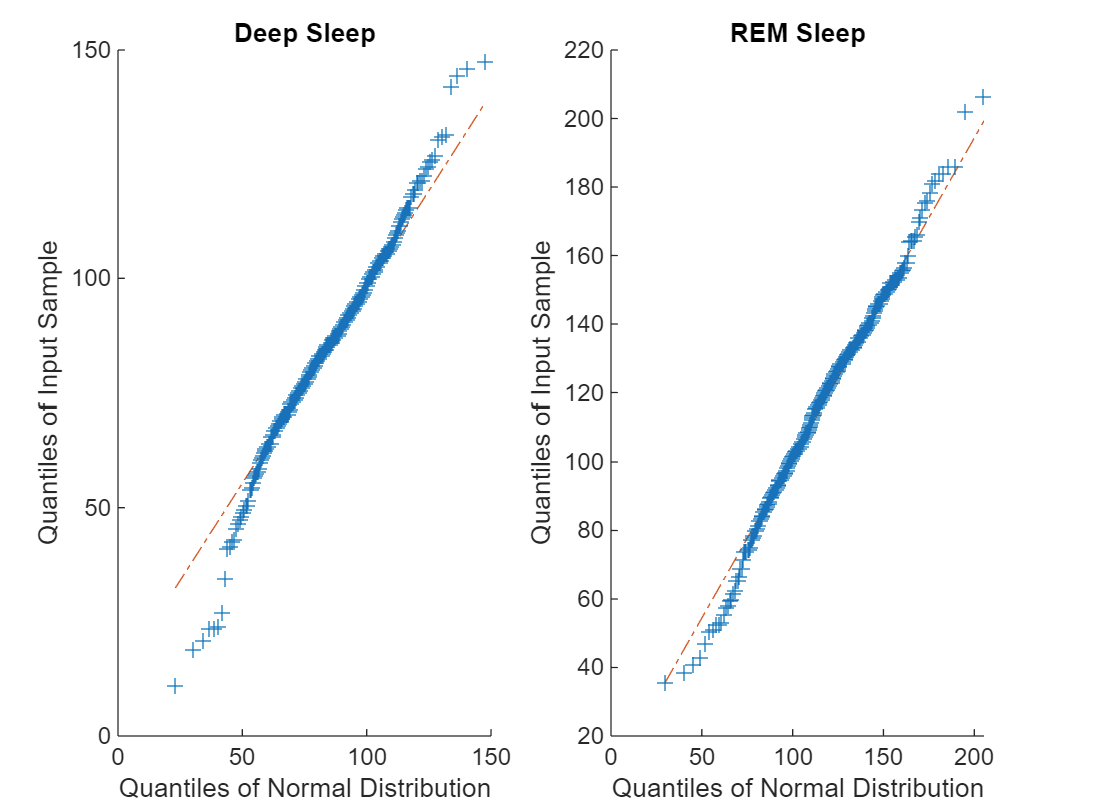
On Skewness:
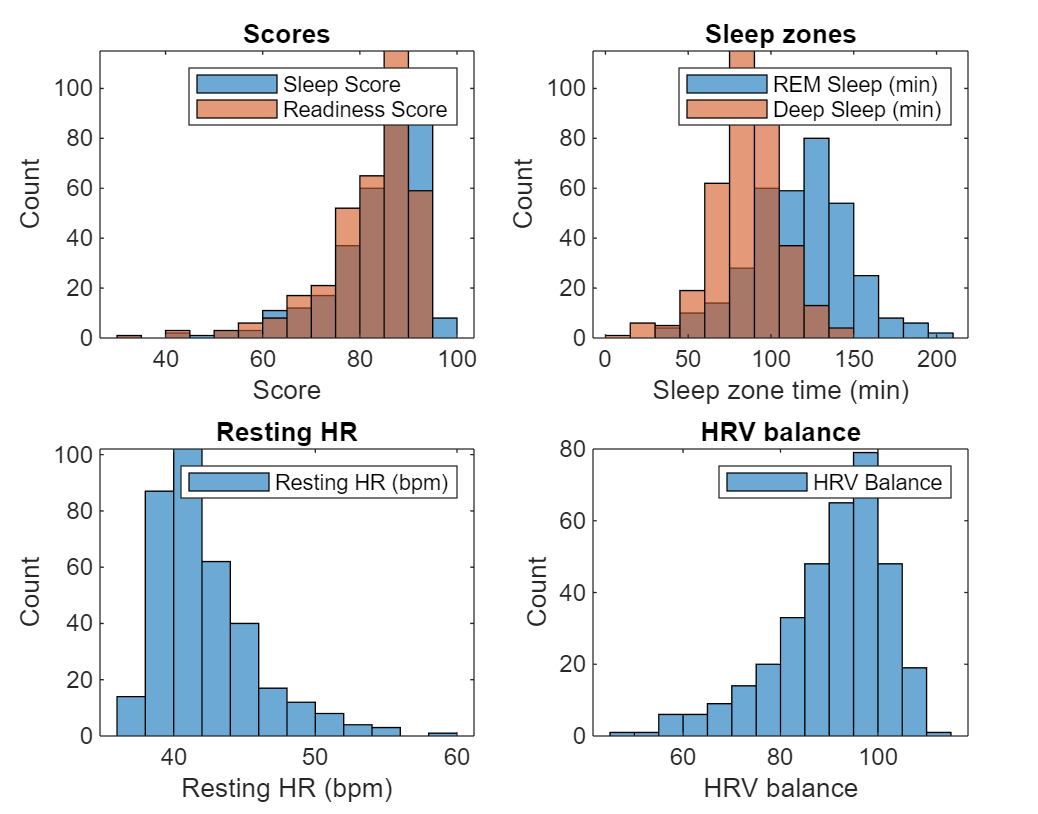
I would have guessed that the two scores skew lower. Skewing left/lower simply means there is an asymmetry in the distribution with more data in the left tail. My reasoning is that for the occasional terrible night’s sleep there is not a counterbalancing amazing night’s sleep. No matter how much you try you cannot make up for a poor night’s sleep (of say ~40 sleep score) with a night of 120 sleep score. I would also guess that HRV balance, deep sleep, and REM sleep also skew left, and that resting HR skews right, using the same logic. We can see however that deep and REM sleep are symmetrical in shape. Not only that, my REM data is normally distributed.
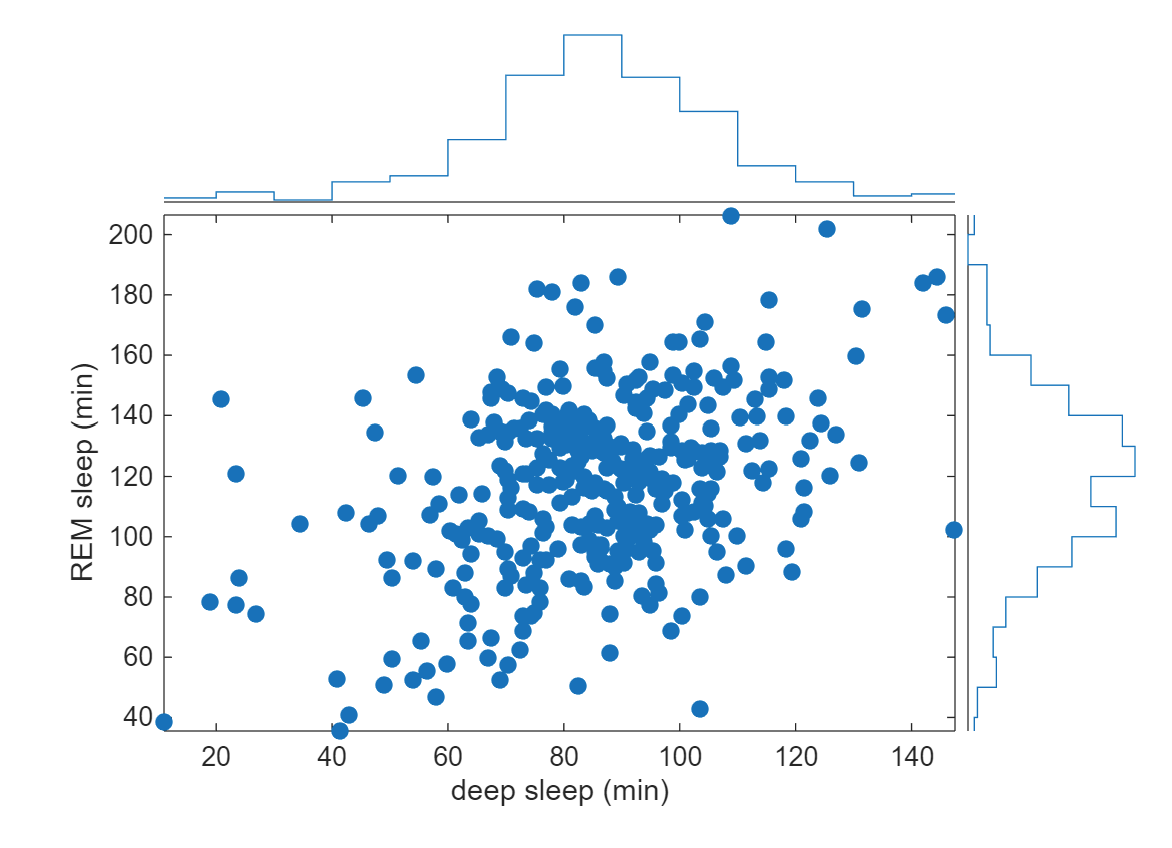
Another surprise is the very weak correlation between deep and REM sleep. For a given deep sleep value, REM can fluctuate by approximately 3x, and for a given REM value, deep sleep can fluctuate by about 2x. In short, total sleep time does not directly dictate the proportions of REM and deep sleep. I wouldn't have guessed this.
More to follow.
Footnotes:
1 On the app, I think it does a poor job of calling out weeklong trends and general out of the norm behaviour. It overly focuses on last night’s values and isn’t opiniated enough when it thinks you are coming down with something or needing to stay rested. The integration with Strava also seems to be lazy, only pulling in data when both apps are open.
2 Oura users can download their data as a CSV from the Oura website. I pulled mine via the API.
3 Sleep score factors in total sleep time, deep sleep time, REM sleep time, efficiency, latency, and restfulness (total sleep time / total bedtime).
4 Readiness score factors in activity balance, body temperature, HRV balance, previous day activity, previous night’s sleep, recovery index, resting heart rate, and sleep balance.
5 Unless it’s so low that you in danger of having a heart attack in the middle of the night, which was a worry in the glory days of EPO use in professional cycling, where the (unsubstantiated) rumour had cyclists getting up in the middle of the night to ride their bikes - to get their heart rate up - to stop their blood becoming haemoglobin custard.
6 HRV balance is heavily correlated with the prior night’s resting heart rate, unsurprisingly.