On understanding Oura's sleep score
(trying to) [Feb 2025]
TLDR: Its tractable other than restfulness. I think if the exact algo was exposed sleep nerds would take issue with it in different ways. Bearish latency?
Intro: Oura’s sleep score is dependent on seven contributing sub-scores, each capturing an important element of sleep; total sleep time, deep sleep time, REM sleep time, sleep efficiency, sleep latency, sleep timing and restfulness. Each of these are calculated from the relevant raw data, and the exact equation is not spelled out anywhere on the Oura website. Can we work out this proprietary algo?
The raw data points for the first three sub-scores are self-explanatory. Here are the other four explained:
- Efficiency: Simply total sleep time divided by total bedtime. The Oura website states that 95% efficiency gets you a 100% efficiency score.
- Latency: Time to fall asleep once in bed. The Oura website states that less than 20mins gives you a 100% latency score.
- Sleep timing: A measure that rewards you for “sticking to your circadian rhythm”, and “keeping your sleep midpoint between midnight and 3am”.
- Restfulness: A measure that takes account of awake time and in bed movement within the sleeping window.
Here is my data for the contributing scores:
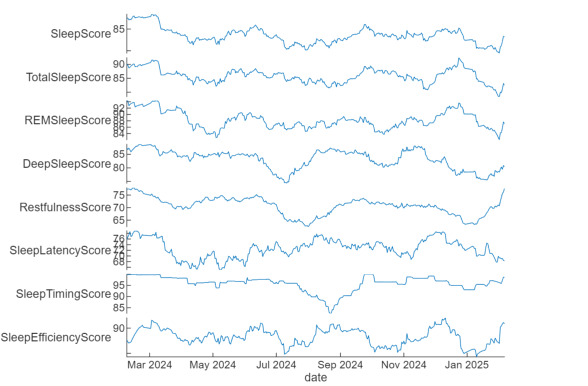
Not much to see. The only interesting thing to note is the drop in sleep timing score due to moving four time zones. Boxplots would be useful:
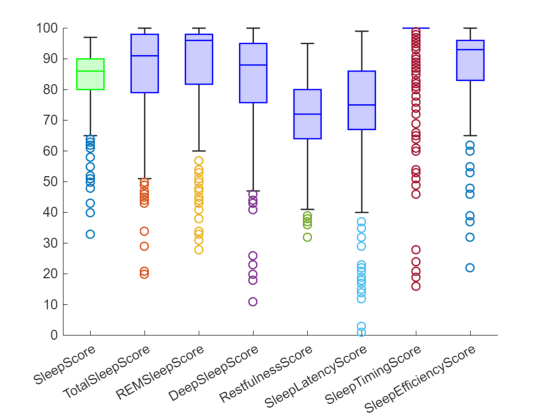
Note the sleep timing boxplot looks like that as I basically always get 100%. All are left skewed. Unsurprisingly my weakest component – Restfulness – is the least skewed. But this post isn’t about my data, for that see this.
How do they correlate with each other? See below.
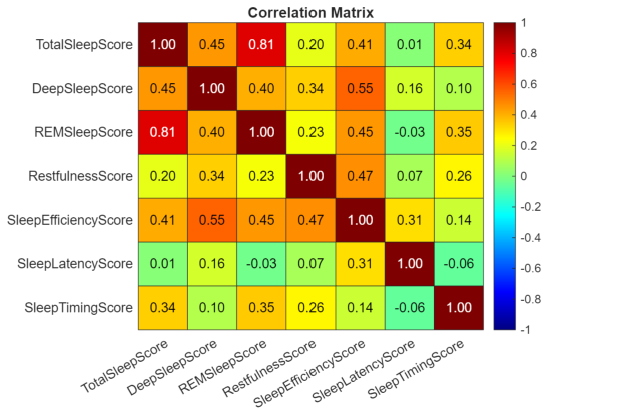
Note that latency is important for deep sleep but not REM, which makes sense as deep sleep comes early in a night’s sleep and it's commonly understood that you can “miss” your deep sleep window, which checks out here. It’s unsurprising that these factors are not correlated as they are constructed to be independent variables. Otherwise, there would be collinearity issues.
So, we have seven independent 0-100 scores that give us our sleep score, do we know the weighting? Well Oura doesn’t say, but we can work it out. Assuming an equal weighting gives an error (RMSE) of 2.56, but we can do better by doing a simple linear regression fit. By fitting to the data, we get an error (RMSE) of 0.331, and an R^2 of 0.999. The coefficients tell us that our final sleep score is 35% total sleep time score, 15% restfulness score, and 10% for every other score.
Is this interesting? Kind of. To me it’s surprising that latency is as important as deep and REM sleep, and that total sleep time gets such a strong weighting. Is it not possible for an elite sleeper to slam deep and REM sleep for seven hours? On latency, does it matter if someone lies in bed for 40mins before slamming perfect deep and REM cycles? It could be argued that sleep latency is fundamentally less important than deep and REM sleep. Sleep latency is also the sleep measurement most prone to error. You can start racking up latency time whilst not even trying to sleep by simply being horizontal on the couch or reading in bed, and ~no one is adjusting their bedtime window the next day (you can manually fix this issue).
But any analysis at this level is somewhat superficial, as we are discussing sub-scores we are yet to detail. So, onward.
Total sleep score time: This is simply linear up to 9 hours of sleep time. No need for a chart.
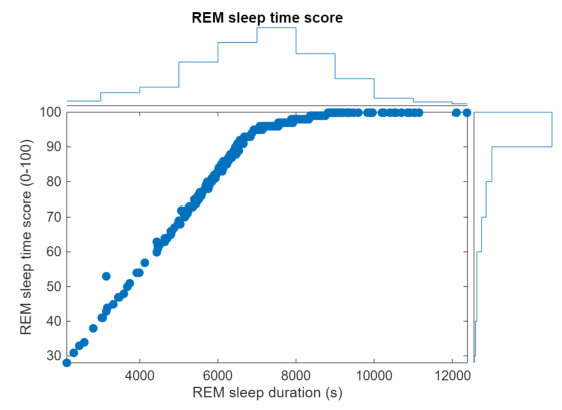
REM sleep score: There are two linear regions. ~110min of REM will get you a REM sleep score of 95, but to get 100 you need ~147min to get a score of 100.
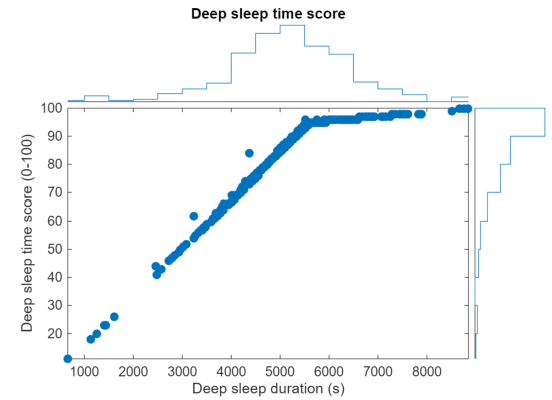
Deep sleep score: Same vibe as REM. ~90min of deep sleep gets you a score of 95, but to get to 100 you need ~144min of deep sleep.
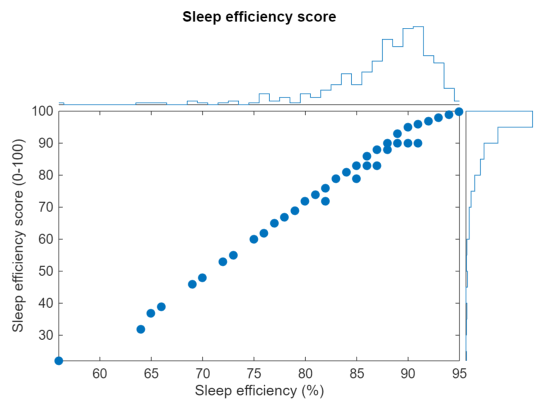
Sleep efficiency score: Same shape again, although there may be some multivariate'y as the anomalies (horizontal distributions) are suspicious. The ceiling at 95% aligns with the Oura website info.
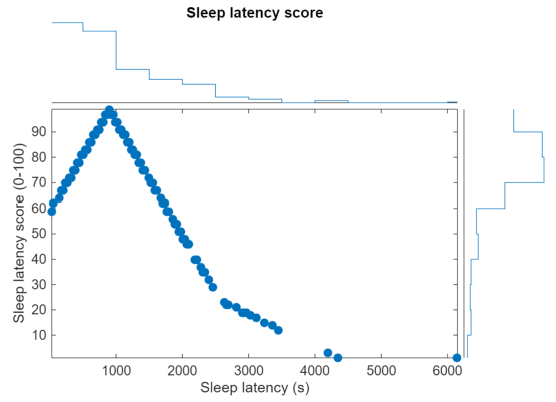
Sleep latency score: Three linear regions where you are punished for being too quick to sleep, as it’s a sign of being under slept. This may be true but I’m not sure it makes sense to punish under-slept people for getting to sleep quickly, after all this is the ideal response? Their 'under sleeping' should be captured in prior scores. Also, the website suggests it's <20min latency that is ideal but it’s actually exactly 15min that gets you the top score. You get a score of 0 if you take 72.5min to get to sleep.
Sleep timing score: If your sleep midpoint is within midnight to 3am you get 100%, and you lose it linearly until you get 0 if your midpoint is at 6am. No need for a chart.
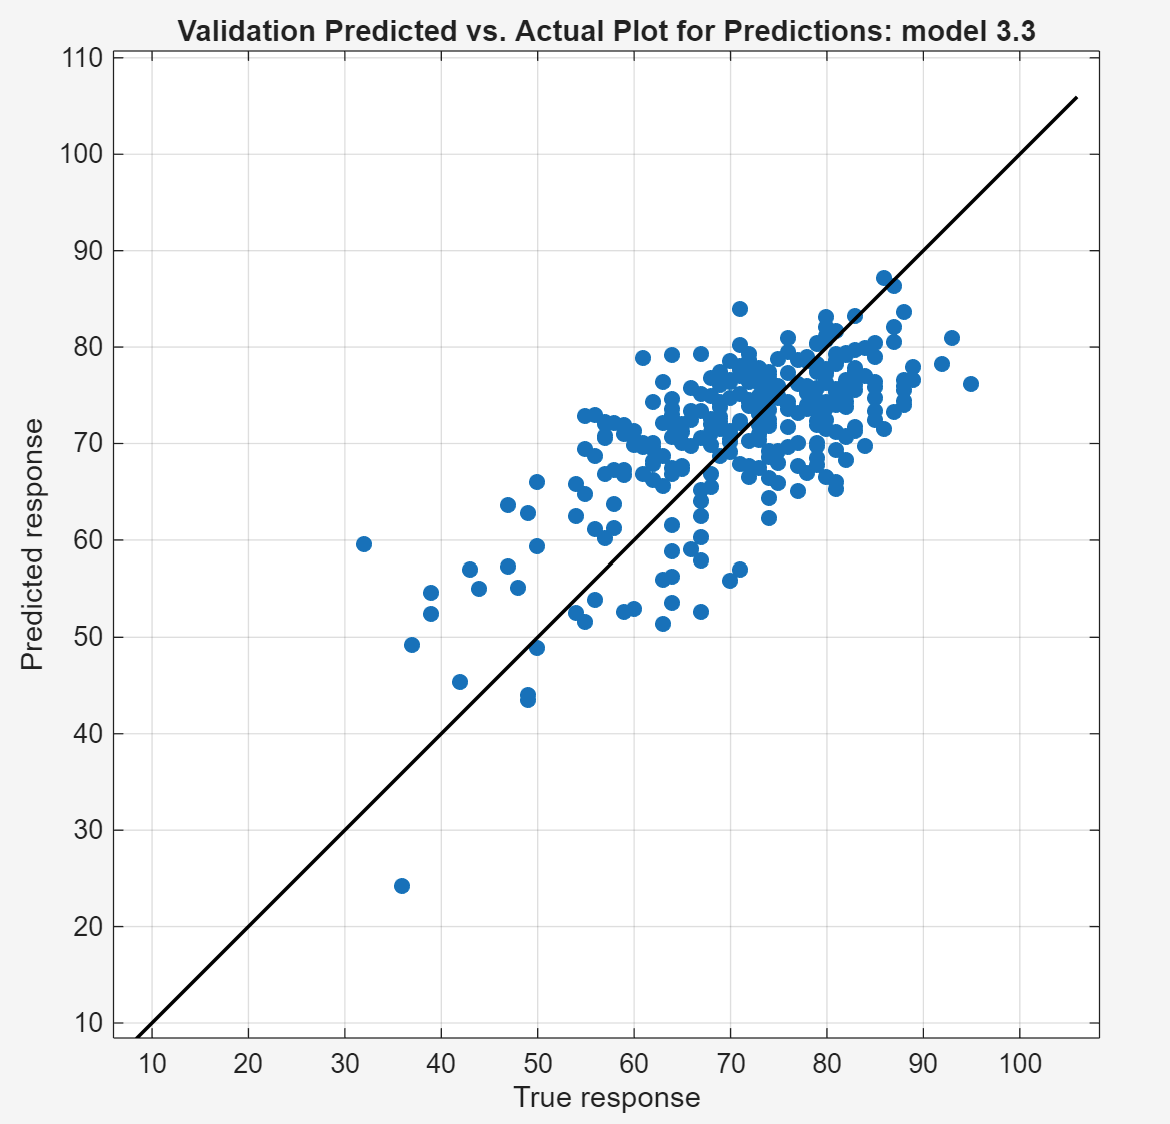
Resftulness score: This is where my analytical powers hit the wall – for now at least. The restfulness score is not explained by the ‘restful sleep’ daily value and also isn’t explained by this in combination with ‘awake time’ daily value. Through some investigative journalism (pestering customer support) I confirmed that there is Oura ‘movement while sleeping’ data that is captured in the restfulness score and is not available for users in their daily values. Via the API you can pull more detailed data that includes ‘restless_periods’ and ‘30s_movement’. Confusingly ‘restless_periods’ seems to be the total minute count of restless time, although it doesn’t perfectly match the daily restless time total. An example ‘30s_movement’ looks like “33311112224444333322211”, which I’m interpreting as four grades of restlessness. You can also get a count of the total sleep periods via the API. But taking all these params the best fit I can get is an error (RMSE) of ~13 - see chart below - via a stepwise regression that should throw out any irrelevant params. Given the simplicity of the other sub-scores I don’t think they are using some more complex model for restfulness, so it might be that only restfulness is truly intractable.
See this github project for data and the sleep score algo in python.